Automatically Creating a Graph: Difference between revisions
Jump to navigation
Jump to search
No edit summary |
No edit summary |
||
| Line 9: | Line 9: | ||
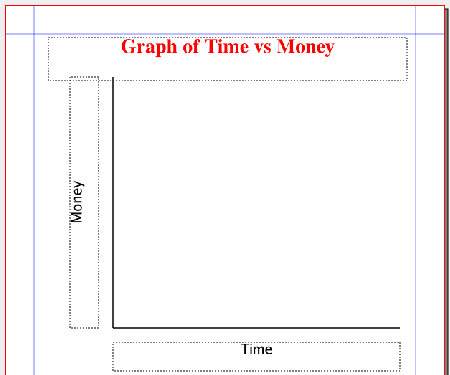
|[[Image:timevsmoneygraph.png|left|thumb|450px]] | |[[Image:timevsmoneygraph.png|left|thumb|450px]] | ||
|- | |- | ||
|<pre> | |Here is the script: | ||
<pre> | |||
#!/usr/bin/env python | #!/usr/bin/env python | ||
| Line 25: | Line 27: | ||
a = 1.5 # width of lines | a = 1.5 # width of lines | ||
if scribus.haveDoc(): | if scribus.haveDoc(): | ||
# Three requestors to get label names | |||
title = scribus.valueDialog('Title','Enter Title') | title = scribus.valueDialog('Title','Enter Title') | ||
xlabel = scribus.valueDialog('X-axis Label','Enter X-Label') | xlabel = scribus.valueDialog('X-axis Label','Enter X-Label') | ||
| Line 30: | Line 33: | ||
scribus.setRedraw(1) | scribus.setRedraw(1) | ||
scribus.setUnit(0) | scribus.setUnit(0) | ||
# First draw the X-axis | |||
d = scribus.createLine(xorigin,yorigin,xorigin+xaxis,yorigin) | d = scribus.createLine(xorigin,yorigin,xorigin+xaxis,yorigin) | ||
scribus.setLineWidth(a, d) | scribus.setLineWidth(a, d) | ||
scribus.setLineColor(color, d) | scribus.setLineColor(color, d) | ||
scribus.setFillColor(color, d) | scribus.setFillColor(color, d) | ||
# Now the Y-axis | |||
d = scribus.createLine(xorigin,yorigin,xorigin,yorigin-yaxis) | d = scribus.createLine(xorigin,yorigin,xorigin,yorigin-yaxis) | ||
scribus.setLineWidth(a, d) | scribus.setLineWidth(a, d) | ||
scribus.setLineColor(color, d) | scribus.setLineColor(color, d) | ||
scribus.setFillColor(color, d) | scribus.setFillColor(color, d) | ||
# The Title text frame | |||
T = scribus.createText(60, 45, 500, 60) | T = scribus.createText(60, 45, 500, 60) | ||
scribus.setTextColor("Red", T) | scribus.setTextColor("Red", T) | ||
| Line 44: | Line 50: | ||
scribus.setFont("Nimbus Roman No9 L Bold", T) | scribus.setFont("Nimbus Roman No9 L Bold", T) | ||
scribus.setFontSize(28, T) | scribus.setFontSize(28, T) | ||
# Label for X-axis | |||
XL = scribus.createText(xorigin, yorigin + 20, 400, 40) | XL = scribus.createText(xorigin, yorigin + 20, 400, 40) | ||
scribus.setText(xlabel, XL) | scribus.setText(xlabel, XL) | ||
| Line 49: | Line 56: | ||
scribus.setFont("Luxi Sans Regular", XL) | scribus.setFont("Luxi Sans Regular", XL) | ||
scribus.setFontSize(20, XL) | scribus.setFontSize(20, XL) | ||
# Label for Y-axis, rotated | |||
YL = scribus.createText(90, 450, 350, 40) | YL = scribus.createText(90, 450, 350, 40) | ||
scribus.setText(ylabel, YL) | scribus.setText(ylabel, YL) | ||
Revision as of 20:34, 17 May 2006
With the collective ability to automatically draw lines and text boxes, Scribus can, without a great deal of work, be used to automatically generate a graph structure. Here I will show some basic Python commands to do that.
This currently works on version 1.3.4cvs. There is a problem with drawing vertical lines from Scripter, which was worked out for 1.3.4, but probably not in earlier 1.3.x versions.
This early version will give three requestors, the first for a title of the graph, the second and third for the labels of the X-axis and Y-axis respectively. The dimensions and coordinates used are presuming points as page units.
Here is an example of the output:
Here is the script:
#!/usr/bin/env python

# File: graph.py
# originally 2006.05.17
# creates basic graph with axis labels

import scribus

xorigin = 150      # x-origin of graph
yorigin = 450     # y-origin of graph
xaxis=400      #x axis length
yaxis=350      #y axis length
color="Black"
a = 1.5 # width of lines
if scribus.haveDoc():
# Three requestors to get label names
    title = scribus.valueDialog('Title','Enter Title')
    xlabel = scribus.valueDialog('X-axis Label','Enter X-Label')
    ylabel = scribus.valueDialog('Y-axis Label','Enter Y-Label')
    scribus.setRedraw(1)
    scribus.setUnit(0)
# First draw the X-axis
    d = scribus.createLine(xorigin,yorigin,xorigin+xaxis,yorigin)
    scribus.setLineWidth(a, d)
    scribus.setLineColor(color, d)
    scribus.setFillColor(color, d)
# Now the Y-axis
    d = scribus.createLine(xorigin,yorigin,xorigin,yorigin-yaxis)
    scribus.setLineWidth(a, d)
    scribus.setLineColor(color, d)
    scribus.setFillColor(color, d)
# The Title text frame
    T = scribus.createText(60, 45, 500, 60)
    scribus.setTextColor("Red", T)
    scribus.setText(title, T)
    scribus.setTextAlignment(1, T)
    scribus.setFont("Nimbus Roman No9 L Bold", T)
    scribus.setFontSize(28, T)
# Label for X-axis
    XL = scribus.createText(xorigin, yorigin + 20, 400, 40)
    scribus.setText(xlabel, XL)
    scribus.setTextAlignment(1, XL)
    scribus.setFont("Luxi Sans Regular", XL)
    scribus.setFontSize(20, XL)
# Label for Y-axis, rotated
    YL = scribus.createText(90, 450, 350, 40)
    scribus.setText(ylabel, YL)
    scribus.setTextAlignment(1, YL)
    scribus.setFont("Luxi Sans Regular", YL)
    scribus.setFontSize(20, YL)
    scribus.rotateObject(90,YL)


    scribus.redrawAll()
|
