Making a Pie Chart: Difference between revisions
Jump to navigation
Jump to search
| Line 5: | Line 5: | ||
==SVG Specifications and Drawing Arcs== | ==SVG Specifications and Drawing Arcs== | ||
For the details and much more information about SVG specifications, check [http://www.w3.org/TR/2000/CR-SVG-20001102/paths.html this link]. | For the details and much more information about SVG specifications, check [http://www.w3.org/TR/2000/CR-SVG-20001102/paths.html this link]. | ||
{| | |||
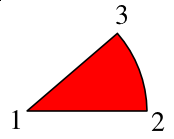
|[[Image:Abcpie.png]] | |||
||Let's start with this idealized pie chart segment. It turns out that the way we are going to use SVG specs to tell a program how to draw this shape is to start with point '''a''', draw a line to point '''b''', then draw the arc from '''b''' to '''c''', then go back to '''a'''. | |||
Here is the path command that will accomplish this: | |||
<pre> | |||
<path d="M 200,200 l 150,0 a150,150 0 0,0 -37,-97 z" | |||
fill="red" stroke="black" stroke-width="2" stroke-linejoin="round" /> | |||
</pre> | |||
|} | |||
Revision as of 01:51, 1 June 2006
The difficulty with making a pie chart with Scribus is that, if there is a way to use the various drawing tools to do it, the programming is quite beyond anything one would want to tackle. What we need then, is a more elegant way. Fortunately, with SVGs, there is a way.
What you cannot do is draw a circle, then subdivide it, because what we really want is a series of segments like variably sized pieces of pie, each of which can have its own fill color. What I want to show in this page is the process of putting information together to make the python script you will find at the end.
SVG Specifications and Drawing Arcs
For the details and much more information about SVG specifications, check this link.
